
Pressure Points: A Distressed Investor’s Read on Q4 2025 U.S. Bank Loan Portfolio Data
NPL trends, charge-off dynamics, and distressed debt investing opportunities across commercial real estate, construction, commercial and industrial, consumer, and agricultural loan books, with quarter-over-quarter comparisons to Q4 2025 U.S. bank loan portfolio data.
Q4 2025 • Commercial and Consumer Analysis • Distressed Asset Outlook
Analysis based on BankProspector’s aggregation of Q4 2025 FDIC and OCC call report data across 3,507 to 4,243 U.S. lenders per category, covering commercial real estate, construction, commercial and industrial, consumer, and agricultural loan books
The Q4 2025 bank loan data across the five commercial and consumer categories tracked here, commercial real estate, construction, commercial and industrial, consumer, and agricultural, shows roughly $7.0 trillion in aggregate loan exposure and $81.4 billion in combined nonperforming loans. NPL rates were mixed quarter over quarter: CRE and agricultural both improved, while construction and consumer ticked up slightly and C&I held essentially flat. The more consistent signal sits beneath the NPL rate, since charge-off activity accelerated sharply in every single category this quarter, a pattern also showing up independently in this quarter’s residential mortgage data.
That broad-based jump in charge-offs, generally 35% to 49% higher than Q3 across all five categories, looks like a genuine shift away from the extend-and-pretend posture that has defined this cycle since 2022. C&I remains the most aggressive category by far, now charging off roughly three-quarters of its NPL balance in a single quarter, while CRE’s charge-off jump came alongside meaningfully higher 30-89 day delinquencies across all three subcategories, suggesting this quarter’s improved NPL rate may not hold. With the 2026 maturity wall now the closest it has been all cycle, the direction of this data suggests the next several quarters are likely to bring more realized distress than the last two years combined.
Q4 2025 Distressed Loan Data: Key Takeaways
- Aggregate loan exposure across the five categories tracked totals roughly $7.0 trillion, with $81.4 billion in combined nonperforming loans.
- Every category saw charge-offs rise 35% to 49% quarter over quarter, even as NPL rates were mixed: improving in CRE and agricultural, flat in C&I, and ticking up in construction and consumer.
- C&I is now charging off roughly 73% of its NPL balance in a single quarter, up from about 54% in Q3, the most aggressive loss-recognition posture in the dataset.
- Credit card charge-offs reached $59.4 billion, more than three times the $19.6 billion NPL balance, the widest inversion anywhere in this dataset.
- Non-owner occupied CRE remains the highest-rate subcategory at 1.58%, even as overall CRE NPL improved to 1.23%.
- Two 2026 opportunity zones stand out: CRE note sales concentrated in non-owner occupied paper, and charged-off credit card receivables.
Quick Definitions
- NPL (nonperforming loan): a loan 90 or more days past due, or on nonaccrual status.
- Charge-off rate: the share of a loan balance a lender has formally written down as a loss.
- Charge-off-to-NPL (deferral) ratio: how much of a lender’s recognized impairment has actually been written off; a wide gap signals deferred loss recognition.
- Extend and pretend: renewing or modifying a troubled loan rather than recognizing the loss, keeping it off the charge-off ledger.
- Non-owner occupied (NOO) CRE: a commercial property loan where the borrower doesn’t occupy the property, repaid from property income or resale rather than business operations.
Commercial Real Estate: NPL Rate Eases to 1.23% as Charge-Offs Jump Across Every Subcategory
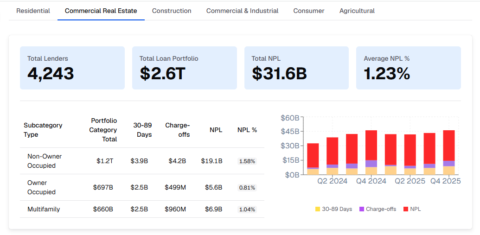
Q4 2025 Commercial Real Estate – $2.6T portfolio, $31.6B NPL, 1.23% average NPL rate
- $2.6 trillion portfolio, up from $2.5 trillion in Q3, about 4% growth and still the largest category tracked here
- $31.6 billion in NPL at 1.23%, down slightly from $32.0 billion (1.27%) in Q3, a rare improvement in this dataset
- Charge-offs rose to roughly $5.7 billion combined across the three subcategories, up from about $4.2 billion in Q3, close to a 36% increase
- 30-89 day delinquencies rose across all three subcategories, from a combined $7.0 billion in Q3 to about $8.9 billion in Q4, roughly a 27% increase in the forward pipeline
- The overall charge-off-to-NPL ratio narrows to roughly 5.5:1, down from about 7.6:1 in Q3, the sharpest quarter-over-quarter shift in loss-recognition posture in the category’s recent history
- The bar chart shows the NPL stack continuing to climb across the eight quarters tracked, even as this quarter’s rate ticked down
- Total lenders fell to 4,243 from 4,280 in Q3, consistent with the gradual lender-count decline showing up across every category this quarter
“CRE’s NPL rate improving to 1.23% looks like good news until you notice that 30-89 day delinquencies rose across all three subcategories at the same time charge-offs jumped by more than a third. That combination suggests lenders are clearing out older impaired positions even as a larger wave of new delinquency is still working its way through the pipeline.”
The charge-off dynamic is the real story in this quarter’s CRE data. Non-owner occupied, owner occupied, and multifamily all saw charge-offs rise between roughly 32% and 45% quarter over quarter, a meaningfully more active loss-recognition posture than the extend-and-pretend pattern that has dominated this category for most of the cycle. That shift likely explains why the overall NPL rate eased even as the portfolio grew, since some previously impaired balances appear to be getting resolved rather than simply carried forward. At the same time, 30-89 day delinquencies grew faster than NPL in every subcategory, which suggests this quarter’s improvement is probably a lag effect rather than a genuine turn in the cycle. For distressed investors, the combination of accelerating charge-offs and a building delinquency pipeline points toward more CRE note sale activity becoming available over the next two to three quarters, particularly in non-owner occupied paper, where the NPL rate remains the highest of any subcategory in this dataset.
Construction Debt: NPL Ticks Up to 0.92% as the Charge-Off Gap Narrows
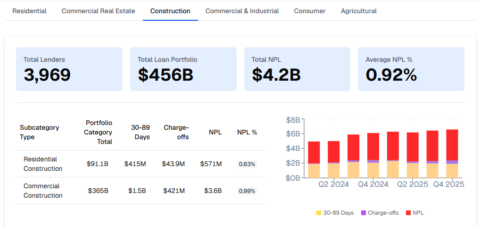
- $456 billion portfolio, down from $463 billion in Q3, about 1.5% contraction and the only shrinking portfolio in this dataset
- $4.2 billion in NPL at 0.92%, up slightly from $4.1 billion (0.89%) in Q3
- Commercial construction charge-offs rose 43% to $421 million from $294 million in Q3, while 30-89 day delinquencies held roughly flat at $1.5 billion
- Residential construction NPL improved to $571 million (0.63%) from $657 million (0.72%) in Q3, with $43.9 million in charge-offs and $415 million in 30-89 day delinquencies now broken out for the first time
- Commercial construction’s charge-off-to-NPL ratio narrows to roughly 8.6:1, down from about 11.9:1 in Q3, still the widest deferral ratio in the category but improving
- The bar chart shows the NPL stack holding in a similar range across the past eight quarters, with no clear inflection in either direction
- Total lenders fell to 3,969 from 3,999 in Q3, a smaller decline than most other categories tracked here
“Construction remains the only category in this dataset with a shrinking loan portfolio, and commercial construction’s charge-off-to-NPL ratio is still among the widest of any subcategory even after this quarter’s improvement. That combination probably reflects lenders avoiding new construction exposure while slowly working through the stalled projects already on their books.”
Construction’s overall NPL rate ticked up slightly this quarter, but the more interesting movement is underneath it. Commercial construction charge-offs rose 43%, a meaningfully faster pace of loss recognition than the category has shown in recent quarters, even though the resulting charge-off-to-NPL ratio still sits near the widest in the entire dataset. Residential construction, by contrast, improved on every metric, likely reflecting the same supply-constrained dynamic that has kept this smaller subcategory relatively insulated from the stress building in commercial construction. The portfolio’s outright contraction, the only shrinking book in this dataset, suggests lenders are pulling back on new construction originations faster than they are resolving existing distress. For distressed investors, commercial construction loan note sales and discounted payoff negotiations likely remain among the more available deal flows heading into 2026, particularly as the widest charge-off gap in the dataset continues to close.
Commercial & Industrial (C&I): Charge-Offs Jump 35% as Loss Recognition Accelerates Further
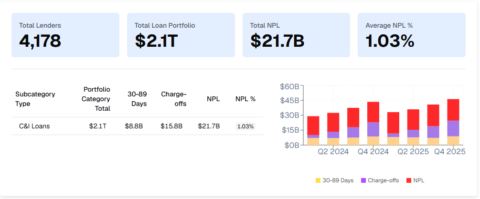
- $2.1 trillion portfolio, essentially flat versus Q3 2025
- $21.7 billion in NPL at 1.03%, essentially unchanged from $21.8 billion (1.04%) in Q3
- Charge-offs rose 35% to $15.8 billion from $11.7 billion in Q3, by far the largest charge-off increase of any category in dollar terms
- 30-89 day delinquencies grew 21% to $8.8 billion from $7.3 billion in Q3, still the largest early-stage pipeline in this dataset
- The charge-off-to-NPL ratio narrows further to roughly 1.4:1, meaning charge-offs now cover about 73% of the NPL balance in a single quarter, up from about 54% in Q3
- The bar chart shows the total stack climbing to its highest point across the eight quarters tracked, driven mostly by the charge-off layer rather than new NPL formation
- Total lenders fell to 4,178 from 4,218 in Q3
“C&I lenders are now charging off roughly three-quarters of what they classify as nonperforming in a single quarter, up from about half in Q3. That reads less like a lender deferring losses and more like one clearing them, and it suggests price discovery in this category is happening faster than anywhere else in the dataset.”
C&I remains the clearest example of active loss recognition in this dataset, and this quarter’s data pushes that further. A 35% jump in charge-off dollars, the largest of any category in absolute terms, moved the charge-off-to-NPL ratio from roughly 54% to about 73% in a single quarter, meaning lenders are resolving a growing share of impaired corporate loans almost as fast as they are being classified. The stable NPL rate alongside a rising delinquency pipeline suggests new stress is still forming even as old positions get cleared at a faster pace, consistent with corporate borrowers continuing to absorb margin compression and higher debt service costs. Unlike CRE or construction, there is little evidence of an extend-and-pretend posture here at all. For distressed investors, the C&I note sale market likely remains one of the most liquid and fastest-moving sourcing environments in this dataset, with sellers already marked close to realistic values.
Consumer Debt: Credit Card Charge-Offs Reach $59.4B as the NPL Inversion Widens
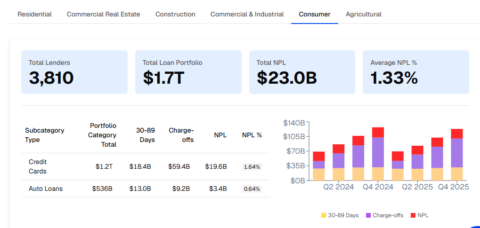
- $1.7 trillion portfolio, essentially flat versus Q3 2025
- $23.0 billion in NPL at 1.33%, up from $21.6 billion (1.30%) in Q3
- Credit card charge-offs rose 35% to $59.4 billion from $44.1 billion in Q3, now more than three times the $19.6 billion credit card NPL balance
- Credit card 30-89 day delinquencies are broken out for the first time at $18.4 billion, a new data point not available in Q3
- Auto loan charge-offs rose 35% to $9.2 billion from $6.8 billion in Q3, while 30-89 day delinquencies grew 8% to $13.0 billion
- The bar chart’s charge-off layer (purple) remains the dominant segment of the consumer stack, uniquely among all categories tracked here
- Total lenders fell to 3,810 from 3,854 in Q3
“Credit card charge-offs running at more than three times the NPL balance is the most extreme inversion anywhere in this dataset, and it widened again this quarter. That gap is mostly a function of how quickly unsecured revolving debt gets written off once seriously delinquent, but the pace of the increase, 35% in a single quarter, suggests card issuers are still absorbing a growing wave of consumer distress.”
The consumer book continues to be primarily a charged-off receivables story rather than an NPL story. Credit card charge-offs jumped another 35% this quarter to $59.4 billion, a figure that now dwarfs the $19.6 billion NPL balance by more than three to one, while auto loan charge-offs rose the same 35% to $9.2 billion. The newly available credit card delinquency data, $18.4 billion in the 30-89 day bucket, suggests this charge-off pace is likely to continue rather than ease in the near term. Auto loan stress remains comparatively more contained, though the growing delinquency pipeline there is worth watching as it broadens beyond subprime borrowers. For distressed investors, bulk purchases of freshly charged-off credit card receivables remain the most liquid and scalable entry point in the consumer book, with card issuers continuing to be motivated sellers of a fast-growing pool of zero-book-value paper.
Agricultural Debt: NPL Rate Improves to 0.76% as Charge-Offs Rise 49%
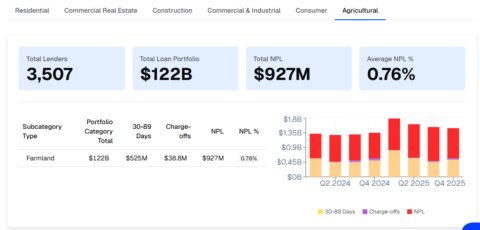
- $122 billion portfolio, up from $120 billion in Q3, about 1.7% growth
- $927 million in NPL at 0.76%, down from $1.0 billion (0.86%) in Q3, the sharpest NPL rate improvement of any category this quarter
- Charge-offs rose 49% to $38.8 million from $26.1 million in Q3, the largest percentage increase in this dataset
- 30-89 day delinquencies rose 14% to $525 million from $461 million in Q3, still building even as the NPL rate improved
- The charge-off-to-NPL ratio narrows to roughly 24:1, down from about 38:1 in Q3, still the widest deferral ratio anywhere in this dataset but improving meaningfully
- The bar chart shows the NPL stack pulling back from its Q2 2025 peak, consistent with the improving NPL rate
- Total lenders fell to 3,507 from 3,545 in Q3
“Agricultural debt still carries the widest charge-off-to-NPL ratio in this dataset by a wide margin, but a 49% jump in charge-off dollars alongside an improving NPL rate suggests lenders are starting to work through some of the collateral-backed patience that has defined this category. Farmland values holding up is probably still doing most of the work here.”
Agricultural debt posted the most improved NPL rate of any category this quarter, but the charge-off data suggests this is more about lenders clearing old positions than about farm income actually recovering. Charge-offs rose 49%, the largest percentage jump anywhere in this dataset, even as the 30-89 day delinquency pipeline kept building, up 14% quarter over quarter. That combination points toward a book where farmland collateral is still supporting an extremely wide deferral posture, roughly 24 dollars of NPL for every dollar charged off, even as the pace of loss recognition picks up. For distressed investors, this remains the category least likely to produce near-term deal flow, since collateral values continue to give lenders room to wait out weak crop income rather than dispose of positions. A sustained downturn in commodity prices or a farmland value correction would likely change that calculus faster than in any other category tracked here.
Looking Ahead: 2026 Opportunity Zones and What the Q4 Data Is Telling Us
The consistent signal across all five categories this quarter is charge-off acceleration, not NPL growth. Every category tracked here saw charge-offs rise between roughly 35% and 49% quarter over quarter, even as NPL rates were mixed: improving in CRE and agricultural, roughly flat in construction and C&I, and ticking up modestly in consumer. That pattern, paired with rising 30-89 day delinquencies in most categories, suggests lenders are moving off the extend-and-pretend posture that has defined this cycle since 2022, even before the bulk of the 2026 maturity wall arrives. With more than $936 billion in CRE loans alone coming due in 2026 on top of what has already rolled over from 2025, the direction of this data suggests the next several quarters are likely to bring a meaningfully more active distressed debt market than the last two years combined.
1. Commercial Real Estate Note Sales, Concentrated in Non-Owner Occupied Paper
Non-owner occupied CRE still carries the highest NPL rate of any subcategory tracked here at 1.58%, and the charge-off jump this quarter suggests lenders are finally beginning to price some of that impairment into disposition decisions rather than continuing to extend. The rise in 30-89 day delinquencies across all three CRE subcategories points toward more NPL formation still working through the pipeline, even though this quarter’s headline NPL rate improved. With an estimated $936 billion or more in CRE loans maturing in 2026, a meaningful share of borrowers who received extensions in 2024 and 2025 are likely to face a genuine refinancing test at materially higher rates than their original loans. Community and regional banks carrying CRE concentrations above roughly 300% of capital face the heaviest regulatory pressure to resolve these positions, making them a reasonable starting point for note purchase outreach. For distressed investors, non-owner occupied paper in particular looks likely to generate more bulk sale and discounted payoff activity over the next two to three quarters as the maturity wall approaches.
2. Charged-Off Consumer Receivables, Credit Card Portfolios
Credit card charge-offs reached $59.4 billion this quarter, more than three times the $19.6 billion NPL balance and up 35% from Q3, making this the largest and fastest-growing pool of distressed consumer paper in the entire dataset. Card issuers are motivated sellers of this zero-book-value inventory, and recovery economics on bulk purchases tend to remain attractive even with collection rates well under 10 cents on the dollar in the current environment. The newly available 30-89 day delinquency data, $18.4 billion this quarter, suggests the charge-off pace is likely to continue rather than ease over the coming quarters. This is also among the more liquid and scalable entry points into distressed bank debt, with established pricing benchmarks and none of the multi-year workout horizon that CRE or construction paper typically requires. For investors building out a broader distressed debt program, charged-off credit card receivables remain a reasonable complement to slower-moving CRE and C&I sourcing efforts.
Taken together, the Q4 2025 data across every category tracked here points toward a credit cycle moving from prolonged deferral toward more active resolution, and investors positioned across both real estate workouts and consumer receivables are likely best placed to capture what comes next.
Data source: BankProspector Q4 2025 bank regulatory filings, aggregated from FDIC- and OCC-supervised call report data across 3,507 to 4,243 U.S. lenders per category, covering commercial real estate, construction, commercial and industrial, consumer, and agricultural loan books. NPL = nonperforming loans. Q3 2025 comparison figures are drawn from the same regulatory filing dataset. All figures as of Q4 2025 reporting period.
Frequently Asked Questions: Commercial and Consumer Bank Loan NPLs and Distressed Debt Investing
Commercial and Consumer Bank Loan Data and Asset Class Questions
Why did commercial real estate’s NPL rate improve to 1.23% in Q4 2025 even as charge-offs and delinquencies both rose?
The most likely explanation is that lenders resolved a batch of older impaired CRE positions through charge-offs at the same time new delinquency was still forming. Charge-offs across the three CRE subcategories rose more than a third combined, which would pull some balances out of the NPL bucket even as 30-89 day delinquencies grew across all three subcategories. That combination suggests this quarter’s improved rate is probably more of a lag effect than a genuine turn in the CRE credit cycle. Investors would probably do well to watch whether NPL formation catches back up to the delinquency pipeline over the next quarter or two.
C&I charge-offs now cover roughly 73% of the NPL balance, up from about 54% in Q3. What does that shift mean for note buyers?
It likely means C&I lenders are marking positions close to realistic values faster than any other category in this dataset. A charge-off-to-NPL ratio that high suggests relatively little deferred loss sitting on the books, which tends to mean fewer deeply discounted NPL pools available but a more liquid, faster-moving secondary market overall. For note buyers, this probably means C&I sourcing looks less like a bulk NPL purchase play and more like a workout-and-recovery play on positions lenders have already priced close to fair value. The pace of this shift, nearly 19 percentage points in a single quarter, is also worth watching as a leading indicator for how other categories might behave as the cycle progresses.
Credit card charge-offs reached $59.4 billion in Q4 2025, more than three times the NPL balance. Is this level of inversion typical, and is it still widening?
The inversion itself is structural and not unusual: credit card debt is unsecured and revolving, and regulatory guidance generally requires issuers to charge off seriously delinquent balances on a fairly short timeline, so annual charge-off flow regularly exceeds the point-in-time NPL stock for this asset class. What is less typical is the pace of growth: a 35% jump in charge-off dollars in a single quarter, alongside $18.4 billion in newly reported 30-89 day delinquencies, suggests the gap is still widening rather than stabilizing. The educated guess here is that credit card charge-off volume keeps climbing for at least the next one to two quarters before any deceleration shows up in the data.
Distressed Debt Investing and Bank Loan Data: Broader Questions
How should distressed investors think about sourcing across five loan categories with different loss-recognition postures in the same quarter?
The charge-off-to-NPL ratio is probably the most useful single screen for comparing posture across categories, since it separates lenders actively resolving distress from those still deferring it. This quarter, C&I sits at the aggressive end, agricultural and construction remain the most deferral-heavy, and CRE and consumer sit somewhere in between. Investors building a cross-category sourcing program would probably do well to match strategy to posture: workout-heavy plays in the deferral-heavy categories, and faster-turnover recovery plays where charge-off activity is already high. Tracking that ratio over two or three consecutive quarters per category, rather than relying on a single data point, tends to give a clearer read on which lenders and categories are approaching a genuine inflection.
What kind of data helps investors build a systematic pipeline for sourcing distressed loan pools across multiple bank loan categories?
In most cases, it comes down to layering two types of information: call report-derived portfolio data showing NPL balances, charge-off rates, and delinquency trends broken out by loan category and geography, and contact data identifying who at each institution actually handles loan dispositions. A platform like BankProspector combines both of these, pairing call report-derived NPL and REO data with verified decision-maker contacts, special assets officers, credit administrators, and loan officers, so investors can filter by geography and loan category, track trends across quarters, and surface the right person at a given institution. Refreshing that view each quarter as new call report data becomes available is probably more efficient than treating each category as a separate, one-off sourcing exercise.
What is the difference between an ‘extend and pretend’ lender posture and active loss recognition, and how did that show up differently across categories this quarter?
Extend and pretend means a lender renews or modifies a troubled loan instead of recognizing the loss, which shows up in the data as NPL balances that grow while charge-offs stay low. Active recognition looks like this quarter’s C&I data, where charge-offs grew fast enough to cover roughly three-quarters of the NPL balance in a single quarter. Construction and agricultural still show the widest gaps between NPL and charge-offs in this dataset, suggesting those categories remain the most deferral-heavy even after this quarter’s improvement. The broad-based charge-off increase across every category tracked here, even the deferral-heavy ones, suggests the extend-and-pretend posture that has defined this cycle is beginning to loosen everywhere, just at different speeds.
The answers in this FAQ are intended for informational purposes and reflect general market observations as of Q4 2025. They do not constitute investment advice. Readers should conduct independent due diligence before making any investment decisions.
