
Still Standing: A Distressed Investor’s Read on Q3 2025 U.S. Residential Mortgage Debt
Non-performing loan trends, charge-off dynamics, and distressed debt investing opportunities across first-position mortgages, junior lien notes, and HELOCs in Q3 2025 U.S. bank loan portfolio data
Q3 2025 • Residential Mortgage Analysis • Distressed Asset Outlook
Analysis based on BankProspector‘s aggregation of Q3 2025 FDIC call report data across 4,273 U.S. residential mortgage lenders
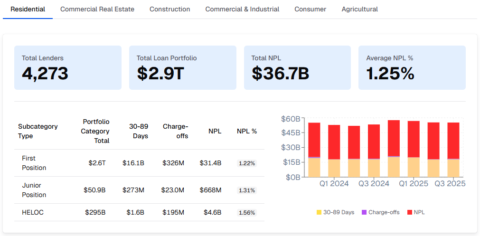
The residential mortgage book is the largest single loan category in the U.S. banking system, with $2.9 trillion across 4,273 lenders with $36.7 billion in non-performing loans at an average NPL rate of 1.25%. It is also, conventionally, the most resilient. Strong home equity buffers built during the pandemic-era price surge, tight post-GFC underwriting standards on conventional loans, and historically low foreclosure rates have kept the headline residential NPL story far more contained than the commercial categories tracked in our Q3 2025 commercial analysis.
2026 sourcing targets: FHA-heavy NPL pools from servicers, and HELOC NPL pools from community banks.
But headline containment is not the same as health. Beneath the $31.4 billion first-position NPL figure, the HELOC book is showing the highest NPL rate of any residential subcategory at 1.56%, late-stage delinquencies are rising faster than early-stage metrics suggest, and FHA loan stress is building in ways that could accelerate into 2026. For distressed investors and bank workout professionals, the residential book is not the primary hunting ground, but it is a sector worth monitoring closely.
Q3 2025 Distressed Loan Data: Key Takeaways
- Scale: the residential book totals $2.9T across 4,273 lenders, with $36.7B in NPLs (1.25% average rate). It’s the largest loan category tracked, and the most resilient.
- Weakest link: HELOCs carry the highest NPL rate in the residential book at 1.56%, even as balances grow to $422B nationally on continued draw activity.
- Deferral extreme: first position mortgages show a 96:1 charge-off-to-NPL ratio, with $326M charged off against $31.4B in NPLs – the most extreme deferral pattern in the entire cross-asset dataset outside farmland.
- Where stress is building: FHA seriously delinquent loans are rising nearly 50 basis points year-over-year, concentrated in Arizona, Louisiana, Indiana, Iowa, and Texas.
Quick Definitions
- NPL (non-performing loan): a loan 90 or more days past due, or on nonaccrual status.
- Charge-off rate: the share of a loan balance a lender has formally written down as a loss.
- First position (senior lien): the primary mortgage, with first claim on the collateral in a foreclosure.
- Junior lien (second position): a subordinate loan like a second mortgage or HELOC, paid only after the first lien is satisfied.
First Position Mortgages: $31.4B in Non-Performing Loans on a $2.6T Book
| Total Lenders | Total Loan Portfolio | Total NPL | Average NPL % |
|---|---|---|---|
| 4,273 | $2.9T | $36.7B | 1.25% |
| Subcategory | Portfolio Total | 30-89 Days | Charge-offs | NPL | NPL % |
|---|---|---|---|---|---|
| First Position | $2.6T | $16.1B | $326M | $31.4B | 1.22% |
| Junior Position | $50.9B | $273M | $23.0M | $668M | 1.31% |
| HELOC | $295B | $1.6B | $195M | $4.6B | 1.56% |
First-position mortgages represent the backbone of the residential book: a $2.6 trillion portfolio carrying $31.4 billion in NPLs at a 1.22% rate. The charge-off figure of $326 million is the lowest of any category in the entire cross-asset dataset, which is strikingly low against a $31.4 billion NPL balance, implying a charge-off-to-NPL ratio of roughly 1%, the most extreme deferral dynamic in the dataset outside of farmland.
- $2.6T first position portfolio, the largest single subcategory across all six loan types analyzed
- $31.4B NPL at 1.22%, a modest rate but enormous absolute dollar exposure
- $326M in charge-offs against $31.4B NPL, reflecting a 96:1 deferral ratio; lenders are almost entirely avoiding first-position loss recognition
- $16.1B in 30-89 day delinquencies, the largest early-stage pipeline in the residential book
- Nationally, the MBA reported the overall mortgage delinquency rate rose to 3.99% in Q3 2025, up 6 basis points from Q2 and 7 basis points year-over-year
“The 96:1 NPL-to-charge-off ratio in first position mortgages is not negligence. In most cases it appears to be rational. With home equity buffers still strong and foreclosure timelines averaging 18-24 months in many states, lenders have little incentive to charge off loans backed by collateral worth more than the outstanding balance. But that calculus changes quickly if home prices soften.”
The structural reason for this extreme deferral ratio is pretty straightforward: first-position mortgage holders are sitting on collateral that, in most markets, still exceeds the loan balance.
Serious delinquency on U.S. mortgage debt stood at 0.83% in Q3 2025, with foreclosures numbering 54,760, well below pre-pandemic norms. But FHA loan performance is driving the deterioration, with the FHA seriously delinquent rate rising nearly 50 basis points year-over-year, while conventional and VA rates remained relatively flat.
For distressed investors, the first position book’s opportunity is concentrated in FHA-heavy geographies and in servicer-driven bulk NPL sale processes where volume offsets thin per-loan economics.
Junior Lien Mortgages: Elevated NPL Rate, Subordinated Collateral, and Growing Delinquency Pipeline
The Junior Position subcategory, covering second mortgages and junior liens, is the smallest in the residential book at $50.9 billion but carries a disproportionate risk profile. At 1.31% NPL, it sits above both first position (1.22%) and the overall portfolio average (1.25%), and its charge-off-to-NPL dynamics reveal a different loss recognition posture than the first-position book.
- $50.9B portfolio: less than 2% of the total residential book, carrying an above-average NPL rate
- $668M NPL at 1.31%, which sits 8 basis points above the portfolio average, reflecting the subordinated collateral position
- $23.0M in charge-offs against $668M NPL, reflecting a 29:1 ratio; still highly deferral-oriented but far less extreme than first position
- $273M in 30-89 day delinquencies, representing a meaningful forward pipeline relative to the book’s size
- Junior lien holders have second claim on collateral after first-position lenders; in a foreclosure, recovery is contingent on equity remaining after the senior lien is satisfied
- Rising first-position delinquencies and softening home prices in select markets could compress the equity cushion protecting junior holders
“Junior lien mortgages are the canary in the residential coal mine. When home prices stagnate or fall in a given market, junior lien holders lose their collateral protection first, and their 1.31% NPL rate already sits above the portfolio average despite the equity buffers that have suppressed broader residential stress.”
Late-stage mortgage delinquencies, specifically loans 120 days or more past due, are rising and historically serve as leading indicators for deeper financial distress, including elevated foreclosure activity. For junior lien holders, late-stage delinquency is particularly consequential: by the time a borrower reaches 120 days past due on a junior lien, the probability of full recovery through foreclosure depends almost entirely on the equity margin remaining above the first-lien balance.
In markets like Arizona, Louisiana, Indiana, Iowa, and Texas, which posted the largest quarterly delinquency increases in Q3 2025, that margin is narrowing. For distressed investors, junior lien NPL pools from community banks and credit unions in these geographies offer asymmetric recovery plays when acquired at sufficient discounts.
HELOCs: Highest NPL Rate in the Residential Mortgage Book with a Building Delinquency Pipeline
Home equity lines of credit are the most stressed subcategory in the residential book by NPL rate, and the most nuanced from a distressed investor’s perspective. The $295B HELOC book carries $4.6B in NPLs at 1.56%, which is 30 basis points above the portfolio average and 34 basis points above first position, on a product that combines the revolving risk of consumer credit with real estate collateral.
- $295B HELOC portfolio, currently growing; HELOC balances rose $11B in Q3 2025 to $422B nationally per the NY Fed, reflecting continued draw activity
- $4.6B NPL at 1.56%, the highest NPL rate of any residential subcategory
- $195M in charge-offs against $4.6B NPL, reflecting a 24:1 ratio; meaningful deferral but more charge-off activity than first position
- $1.6B in 30-89 day delinquencies; the early-stage pipeline is building relative to book size
- HELOC balances are at their highest level since 2010, driven by homeowners extracting equity rather than refinancing locked-in low-rate first mortgages
- Rising draw activity means exposure is growing even as existing NPLs season
“HELOCs represent a concentrated and underappreciated risk within the residential book. Borrowers are drawing on equity lines to manage cash flow pressure from inflation, credit card debt, and student loan resumption, essentially converting home equity into consumer leverage. If home prices soften, that equity disappears and HELOC NPLs accelerate rapidly.”
Current 30-day HELOC delinquency rates are 2.24%, up 26 basis points year-over-year, while serious 90-day delinquency rates have risen to 0.72%. The draw activity driving HELOC balance growth is a double-edged dynamic: on one hand, it reflects homeowner confidence in their equity position; on the other, it adds leverage to balance sheets already under pressure from other consumer debt categories.
HELOCs have shown greater stability than first mortgages in delinquency terms, but stability should not be mistaken for immunity. Persistent inflation, elevated consumer debt, and deferred financial obligations could introduce volatility into HELOC portfolios with limited early warning.
For distressed investors, the 1.56% NPL rate and growing draw balances make HELOC pools from community banks an increasingly interesting secondary market target, particularly in markets where home price appreciation is stalling.
Looking Ahead: Residential Mortgage Distress Trends and the Top Two Distressed Debt Opportunity Zones for 2026
The residential mortgage book enters 2026 in a structurally sound but directionally deteriorating position. The combination of a softening labor market, FHA loan stress, rising late-stage delinquencies, and growing HELOC draw activity against a backdrop of still-elevated mortgage rates creates conditions for a gradual but sustained increase in residential NPLs over the next four to six quarters.
The 96:1 charge-off-to-NPL ratio in first-position mortgages means that when lenders do begin to move, whether through regulatory pressure, price softening, or borrower exhaustion, the supply of actionable residential distressed assets will materialize quickly.
Two opportunity zones stand out for distressed capital focused on the residential book:
1. FHA-Heavy NPL Pools: Bulk Servicer Sales in High-Delinquency Geographies
The FHA seriously delinquent rate rising nearly 50 basis points year-over-year is the clearest single signal of where residential distressed supply will surface first. FHA loans are concentrated in lower-income and first-time buyer demographics, precisely the cohort most exposed to the combination of stretched affordability, softening labor markets, and the exhaustion of COVID-era loss mitigation options.
States posting the largest Q3 2025 delinquency increases, led by Arizona, Louisiana, Indiana, Iowa, and Texas, represent the highest-probability sourcing geographies for bulk NPL purchases from banks and servicers managing FHA-heavy portfolios. At the right discount, first-position FHA NPLs with intact equity margins offer recovery economics that are both predictable and scalable.
2. HELOC NPL Pools: Community Bank Secondary Market
The 1.56% HELOC NPL rate, growing draw balances, and the structural vulnerability of second-lien HELOC holders in a price-softening environment makes this subcategory the most actionable near-term residential opportunity for distressed investors.
Community banks with concentrated HELOC exposure in markets where home price appreciation is flattening are the most likely motivated sellers, particularly as regulatory scrutiny on home equity concentrations increases heading into 2026.
HELOC NPL pools acquired at meaningful discounts to UPB offer a combination of real estate collateral upside and consumer recovery optionality that is difficult to replicate in other residential subcategories. The $195M in Q3 charge-offs (small relative to the $4.6B NPL balance) confirms lenders aren’t clearing these positions aggressively yet, but that posture will no doubt shift as the draw-and-default cycle matures.
The overarching residential thesis for 2026 is one of patience and positioning. The book is not in crisis, but the directional pressure is clear, the FHA pipeline is building, and the HELOC draw cycle is adding leverage to balance sheets that are already under strain from every other consumer credit category.
For distressed investors positioned in the right geographies with the right servicer relationships, the residential distressed debt market will be meaningfully more active in 2026 than it was in 2025.
Data source: BankProspector Q3 2025 bank regulatory filings aggregated across 4,273 U.S. residential mortgage lenders. Additional context sourced from MBA National Delinquency Survey, Federal Reserve Bank of New York Consumer Credit Panel, and Experian risk analysis. All figures as of Q3 2025 reporting period.
Frequently Asked Questions: Residential Mortgage NPLs and Distressed Debt Investing
Why is the charge-off rate on first-position residential mortgages so low relative to the NPL balance? Is this a sign of lender negligence or strategic deferral?
In all likelihood, it’s largely strategic rather than negligent, though the line between the two can blur over time. Most first-position lenders still appear to be sitting on collateral that, in the majority of markets, covers the outstanding loan balance, which makes charging off a loan before exhausting workout options economically counterproductive.
Regulatory frameworks also tend to give banks more latitude on charge-off timing for collateralized real estate than for unsecured debt. That said, the 96:1 ratio does seem unusually extreme, and if home prices soften in FHA-heavy markets where equity margins are thinner, that deferral posture could shift more quickly than the current data implies.
HELOCs have the highest NPL rate in the residential book at 1.56%. What makes them more stressed than first-position mortgages, and should that gap widen heading into 2026?
A few structural factors likely explain most of the gap. HELOCs are variable-rate and revolving, so borrowers who drew on lines during the low-rate window have seen payment obligations climb considerably, and they sit junior to first-position liens, meaning foreclosure recovery is contingent on equity remaining after the senior lender is paid.
There’s also a behavioral element worth watching: draw activity suggests some borrowers may be tapping equity to manage other obligations, which historically tends to precede default rather than follow it. If home price appreciation continues to flatten in the markets where HELOC balances are most concentrated, the educated guess here is that the NPL rate gap between HELOCs and first-position mortgages widens further through 2026.
The data shows FHA loans driving most of the residential delinquency deterioration in Q3 2025. What does that mean for note buyers targeting residential NPL pools?
It’s probably a more meaningful sourcing signal than it might appear at first glance. FHA portfolios tend to have thinner equity cushions and more geographically concentrated stress. The states showing the largest Q3 delinquency jumps (Arizona, Louisiana, Indiana, Iowa, and Texas) seem like the most logical starting point for targeting community banks with FHA-heavy NPL exposure.
The key underwriting question is likely whether current valuations leave enough equity above the first lien to support a recovery strategy, or whether the better play is a negotiated discounted payoff. The more granular your lender-level data on NPL balances and trends by geography, the more efficiently you can identify which institutions may be approaching a disposition decision rather than continuing to extend.
Distressed Debt Investing and Bank Loan Data: Broader Questions
How do distressed debt investors typically source residential NPL pools directly from banks, and what data do they need before approaching a lender?
In most cases, direct sourcing seems to come down to two parallel inputs: identifying which banks are the most likely motivated sellers, and knowing who at the institution actually has authority over loan dispositions. Call report-derived data, specifically NPL balances by category, REO holdings, and charge-off trends over recent quarters, tends to be the most useful starting point for building a target list.
A bank that has been accumulating NPLs for several consecutive quarters without a proportional increase in charge-offs is probably closer to a decision point than one that’s been actively clearing its book. Tools like BankProspector layer verified decision-maker contacts like special assets officers, credit administrators, and loan workout staff on top of that call report data, allowing users to compress the time between identifying a target and getting the right person on the phone.
What is the difference between a bank’s NPL rate and its charge-off rate, and why do both carry weight when evaluating distressed debt opportunities?
They’re measuring different stages of the same deterioration process, and the gap between them is often where the signal lives. The NPL rate reflects the stock of impairment the bank has recognized at a point in time: loans 90 days or more past due or on nonaccrual. The charge-off rate reflects how aggressively the bank is writing that impairment down.
A wide gap between the two, typically high NPLs alongside low charge-offs, tends to suggest a lender that is deferring loss recognition. And distressed loan buyers find the most opportunity there. Tracking both together across multiple quarters, filtered by loan category and geography, usually gives a clearer picture of which institutions may be approaching a disposition threshold than either metric alone.
How can distressed debt investors build a direct bank note-buying pipeline without relying on loan sale brokers?
The broker channel has its place, but it tends to be competitive and late-stage by the time deals reach you, which typically means compressed margins (because everyone else between bank and buyer already made their money on it). The more efficient path, in most cases, seems to be building a systematic prospecting process around quarterly call report data: identifying banks with rising NPLs, low charge-off rates, and elevated loan concentrations that put them in regulators’ crosshairs.
From that filtered target list, the next layer is contact intelligence: knowing which specific individual at each bank handles special assets or portfolio sales. Refreshing that target list each quarter as new call report data becomes available and reaching out directly, before a formal sale process is launched, is probably where the most favorable deal economics tend to be found.
Where can distressed debt investors find residential mortgage NPL pools for sale heading into 2026?
Most residential NPL pools reach the market through one of two channels: broker-run bulk sale processes, or direct outreach to the bank or credit union still holding the loans. The broker channel is easier to access but more competitive, since every buyer sees the same tape at the same time.
Direct sourcing means building a target list from call report data, zoning in on banks with rising NPLs and low charge-off rates in the FHA-heavy or HELOC-concentrated geographies flagged above and then reaching the special assets officer or credit administrator before a formal sale process starts. That’s typically where pricing is most negotiable, and it’s the workflow tools like BankProspector are built to support.
The answers in this FAQ are intended for informational purposes and reflect general market observations as of Q3 2025. They do not constitute investment advice. Readers should conduct independent due diligence before making any investment decisions.
